What Advantages Does The Oscilloscope Measure Have?

Template:Delete candidate

The oscilloscope measurement[edit]

The best possible time / signal response is the sole criterion for correct reproduction. The inseparability of time and amplitude alone characterizes the audible. Thus, in the end, only this can be the criterion for the evaluation of loudspeakers. The visualization of the sound waves is done by the oscilloscope.

An example:
We record the attack of a tom or a piano string with a microphone. The microphone converts the acoustic sound wave structure into an electrical oscillation structure. This electrical vibration structure is to be converted back into the equivalent sound wave structure by our electroacoustic transducers (loudspeakers). The only thing that matters is that the electrical input structure is identical to the acoustic wave structure generated by the transducer.
This can be objectively verified by comparing the waveforms using an oscilloscope. If the waveforms match, then all theoretical model aspects, such as frequency response, phase response and distortion are also correct. And also the pitches will be reproduced correctly. In the case of the loudspeaker, it is only important to generate the correct sound amplitude (including the correct polarity) at every point in time during the course of the event. Then, only then, can we hear the recorded original, the strike of the tom or the piano string, true to the original, because it is precisely this sound pressure curve that affects our hearing organ. If there are deviations, which is, however, the reality with the current state of loudspeaker technology, then the theoretical model aspects can help us to determine the reasons for this.

Measurement diagrams are there to give the knowledgeable expert clues to transmission characteristics and serve as a tool for finding faults and their causes. They do not include instructions on how to avoid errors and how to reconstruct the original signal. Only oscilloscope representations show the complex oscillation structure, the sound pressure fluctuations, which also excite our hearing organ. Nevertheless, a phenomenon is usually found in each partial view or in a specific way in each measurement. Example. We see the diaphragm resonance of a midrange driver:

  • in the frequency response diagram as a level rise
  • in the acoustic phase measurement as a phase rotation
  • in the group delay diagram also as a fluctuation on the time plane
  • in the electrical phase measurement also as a phase fluctuation

in the waterfall diagram in the decay also as ripple

  • in the impulse response as a post oscillator

in the sinusoidal measurement as deformation

  • in the spung response as a peak with subsequent dip and subsequent ringing, etc., etc.

However, it is and remains the diaphragm resonance of a midrange driver.

If you look at the sound structure of a piece of music on an oscilloscope, you can see that music is essentially a series of transients. The striking thing about transients is that they stick out of the sound mixture like skyscrapers. They are the sound structures that are many times louder, precisely the peaks that cause the masking effects in relation to subsequent sound waves. Myro has been making sound recordings with the oscilloscope for a very long time and has been searching for or developing sound waveforms that are suitable for testing the transducer capability of a loudspeaker while providing the clearest possible information. When switching on different filters, one can see, for example, the change in the temporal expansion of the first half-wave and the amplitude changes corresponding to the filter slope, while the temporal origin remains the same. Strictly speaking, a chassis can only reproduce the first half-wave with the correct frequency at exactly one single frequency! This can be easily verified with oscilloscope measurements.
Oscilloscope measurements provide the most complex image of sound events, the sound pressure fluctuations with their temporal course. They are the basis for mathematically generated, complexity-reduced, theoretical evaluation aspects. They are thus closer to the real nature of sound than the mathematical derivations from them. Oscilloscope measurements can be used to prove and verify whether or not developments and adjustments work in the complexity of the reality of sound using mathematically derived measurement models. There is no magic in passing a simple signal or complex signal structure through a transmission line and looking at what comes out at the end. In this there is a right or wrong. Right could be defined as "neutral". In the case of gross deviations from INPUT = OUTPUT, there is actually no need for any further discussion. The problem of an unambiguous assessment arises when the deviations are complex and / or small. This is where subjective interpretation of objective criteria begins. In many discussions we are often in this area.

To summarize:
Oscilloscope representations show us the whole, the sound. A theoretical model aspect does not show us the whole, does not show us the sound. Somehow defined (by whomever) claims for the fulfillment of theoretical model aspects have no usable reference whatsoever for the human imagination with regard to the sound event. Who can seriously describe the sound character, the subtle oscillation of an instrument or even the character of a voice hidden in it when looking at a frequency response, phase response, distortion K2 K3 K4 and group delay diagram?
The time/signal behavior, the inseparability of time and amplitude alone characterizes the audible. Thus, in the end, only this can be the criterion for the evaluation of loudspeakers.

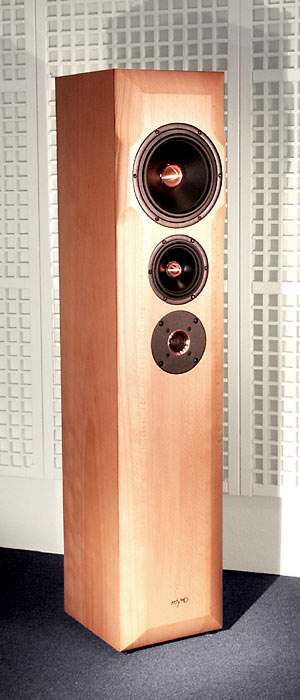
Kleiner Erlkönig 02.jpg
Myro Small Erlking

Slimline .jpg

Myro Slimline'

The jump response[edit]

You only get a jump response in response to a jump. Only a jump excites a transducer the way a jump does. And only when a transducer has been excited with a step can it give a step response. As soon as one uses an excitation which puts the transducer into a transient state, the "calculated step response" determined from this does not contain the identical information. Turning transients into periodically recurring signals leads in the wrong direction. Transients, like everything else in music, do not repeat in identical form and transient states in music can only be generated electronically. Music is basically a sequence of changing transients. Transient states occur only approximately and rather quietly.
The step response is the direct analysis of the waveform in the time domain. It is a measurement signal with a not insignificant difference to the impulse: The step response differs metrologically from the impulse response by its energy content and supplies in relation to the impulse that energy which is necessary to excite the entire system completely. By contrast, only partial aspects are calculated by the derivatives of step responses or impulse responses. The information about the complete original signal form can then no longer be seen. Interpretations, however, can always refer only to the parameters contained in the derivation (under the assumptions, exclusions and conditions of the measurement model and the applied mathematical model). Measurements and their mathematical derivations that result from waveforms that keep the loudspeaker drivers in an oscillating state during the measurement process are not suitable for assessing transient response and thus overall behavior. Loudspeakers are complex transducers, electro-mechanical-thermal-acoustic, and cannot be fully described by an electrical equivalent circuit. There are a whole host of factors that preclude proper step response, proper transduction. All of them are individually exclusion criteria!
Step response correlates with all other oscilloscope measurements. A speaker with a deformed step response will also deform other waveforms accordingly. With the oscilloscope-based measurement methods, there are currently the clearest imaging methods that can show and prove the "correct transformation" of sound structures. Thus all loudspeakers that do not show a clean step response are eliminated.
The correct choice of measurement conditions is of great importance. A step response generated by a step signal is actually only valid as a single event at the moment of measurement, because the result can vary depending on the time of measurement, the step height, the thermal condition of the chassis and other factors. This also applies to other measuring methods (like square wave, MLS, chirp, half sine ...) So you actually only get the step response for exactly the set operating case. You should therefore perform measurements at different levels (from the smallest signal to see e.g. hysteresis effects due to friction - up to full scale), because you need various measurements at different operating points to fully capture the behavior, in order to detect certain linear and non-linear distortions.
In addition, one should carefully select and test the measurement amplifier. A very large number of amplifiers are not capable of delivering low-frequency square-wave signals or even a pure DC step. Also a clean rising edge is usually a problem for amplifiers.

Can the Fourier transform (FFT) replace oscilloscope measurements?[edit]

It is often argued that direct measurement of the step response can be replaced by mathematical simulation using the Fourier transform. On the one hand, in the step measurement we have the real stimulus "voltage step" from zero to the given DC voltage. This stimulus - and only this stimulus - excites the chassis. On the other side we have the model "Fourier analysis", a theoretical method to determine, under certain model assumptions, from which sound waves the real stimulus could be formed if they were cumulated in magnitude and time. The result of the Fourier analysis is a theoretical construct, not a real stimulus, therefore it does not excite a chassis.

If one calculates the impulse response from the step response by differentiation (the other way round, the step response is the integral of the impulse response over time), then one can also convolve the impulse response with a step or a square wave signal. In this respect, for an LTI system, the results can be calculated from the impulse response, whether it is a step, a square wave, a half sine, a cosine burst, etc. that is used to convolve the impulse. This is clearly, but limited valid to linear and time invariant systems.

The limits of the theory
At this point we already have to make the first restriction. It is true that a loudspeaker is time-invariant, otherwise one could not set filters. But linear it is not on close inspection. We have the problem of non-linearities in the drive and in the whole movement process and additionally that of the stroke limit and the thermal compression. Almost every part of a chassis is nonlinear. The suspensions have compliance that corresponds to some function, at least in theory. But they also have resonant behavior. They generate natural vibrations that propagate as structure-borne sound in the material, in materials connected to it, and in the environment in the form of sound waves that are reflected, and so on. The interaction with the other components of the chassis are manifold, complex, chaotic! The diaphragm and enclosure also add nonlinearities. Here the assumption of a linear system can be approximate at best and this leads to deviations of the simulation from a real measurement with real bounce excitation.

Possibilities and limitations of the Fourier transform
The Fourier transform itself is basically a computational process that convolves the pulse response with theoretically infinitely long (in practice it works shorter) sinusoidal frequencies. This results in steady-state states for each frequency with a respective amplitude and phase. And from this, frequency- and phase-response can be drawn. With the methods of a Fast Fourier Transformation, one no longer has to laboriously generate and measure the test signals, it is mathematically more straightforward.
With this it is also clear that the FFT does not allow statements about transient states. It is only a tool, nothing more, another way of displaying the system analysis. Now music is not a steady state. An FFT is the wrong analysis tool here, because the premise of 'periodicity' is not and cannot be fulfilled, since one wants to look at a one-time change of state, the transient. In this respect, the FFT only makes sense if you want to look at a spectrum with respect to the transients in the frequency response (with envelope, so to speak). So with the FFT you can only recognize a partial section of what you really hear.

The stimulus only knows one (or in the case of a rectangle two) voltage changes, namely the voltage jump at the beginning and the voltage drop at the end. In between there is DC voltage! However, the DC voltage state is not a stimulus for an electrodynamic transducer, only the voltage change can be.
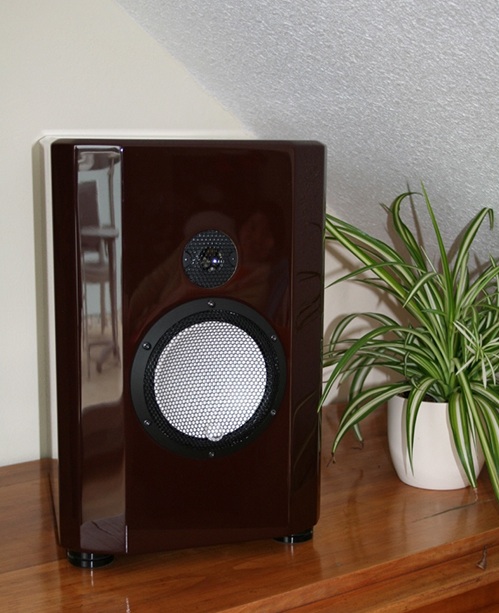
Just because a Fourier analysis outputs a certain result in the form of waves (alternating voltage) does not mean that the DC voltage becomes an AC voltage. Here, an invalid inverse is formed from two completely different separate model levels. Theoretically the stimulus can be formed from a conglomerate of certain AC voltages / frequencies. However, this does not make the real stimulus an AC voltage (on/off excluded). The real measurement in the following example is the proof. There is no difference in the sound response of the drivers when measured with step or 30 Hz rectangle. RSD-1 70.jpg
Myro Amur RSD

Vergleich Step zu Rechteck (30 Hz).jpg

Example:
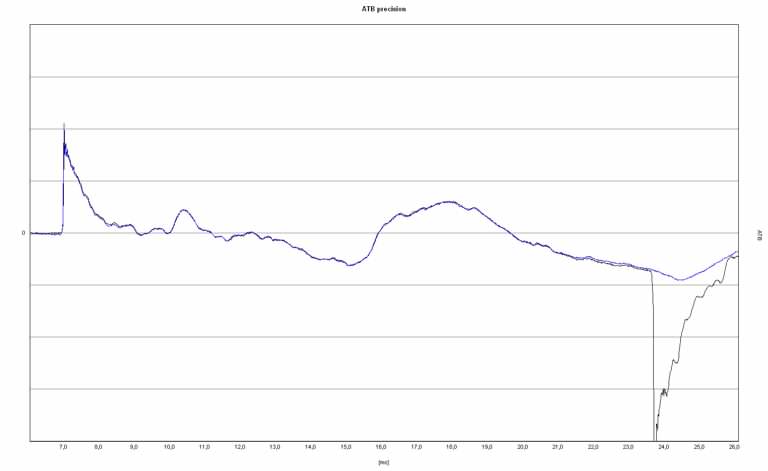
Comparing step responses with original DC step measurement and with mathematical derivation from measurement signals measuring the loudspeaker in quasi-square response.

In the following diagram we see the comparison between a step measurement (blue) and a square wave measurement (black / frequency = 30 Hz). Both signals excite the loudspeaker equally jumpy. We can clearly see the difference between a step response from the zero position compared to the one from the oscillating behaviour. In the first step response excitation the drivers start with an initial velocity v = 0. In the second, inverted step response excitation the drivers start from the forward position (+DC with initial velocity v = 0) towards the zero position and beyond to the backward position (-DC) and reach the maximum velocity of the diaphragm movement in the area of the zero position. Consequently, the initial velocities of the two step responses are:

  • For the first step response v = 0.
  • At the second step response v = max.

And therein is precisely the difference to be understood between step response measurements with a real oscilloscope step and the derivation from a measurement signal where the loudspeaker is measured from the oscillating state.

The second step response of the loudspeaker in the square wave measurement just before 24 ms shows us, in contrast to the first step response at the beginning, the following:

1. A significantly higher amplitude, but this does not result from the fact that the inverted drive of the loudspeaker is fundamentally different.

2. a clear increase in the amplitude of the rising edge, the higher frequencies and a relatively small one at lower frequencies.

  • Blue: Excitation with step function
  • Black: excitation with square wave f = 30 Hz

Since it makes no difference in the time window suitable for displaying and evaluating the step response (approx. 2 - 5 ms) and beyond, measurements with low-frequency rectangles are fine.


<zurück: Myroklopädie>
<zurück: Myro>