Interpretation Of Jump Answers - Examples From The Measurement Technique
The ideal course
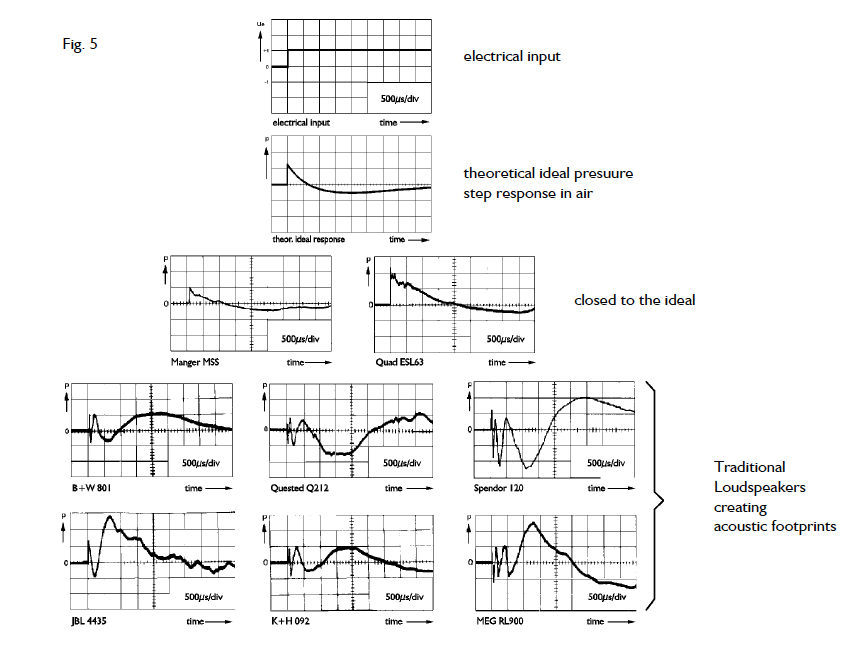
The excitation of the loudspeaker is a square wave, i.e. the diaphragms are moved forward abruptly. This creates a pressure wave that propagates in the direction of motion. Since there is no further pressure after the forward movement of the diaphragms is complete, there is a pressure equalization in the air. This pressure equalization is manifested in the step response in the form of an elongated undershoot of the zero line. This restores the original static pressure of the environment. However, this pressure compensation by negative pressure can only contain the energy that was previously exerted on the air in the form of a pressure wave.
However, if we see a clear disproportion between pressure input above and pressure compensation below the zero line, there can be two possible explanations:
- the moving mass (the tensioned spring) is very poorly damped
and / or the woofer doesn't swing forward at all, thus producing a negative pressure wave instead of a pressure wave The sound waves would thus be "in phase" with a phase difference of 180 degrees.
Source: www.audio-intl.com
The step response looks ideally different than ideally related to a limited transmission range. It approaches more and more a square wave the more broadband and phase-locked a system is. You will always see the low pass at the beginning and the high pass at the end. Music doesn't produce square wave signals, but it does produce something similar, such as hand clapping or percussion instruments. The point is to check and recognize if a loudspeaker is able to follow the dynamic music signal or not. For this purpose, the first rectangle or the jump is of particular importance.
Small deviations from the ideal
When we look at a distorted step response, we know that the transfer response is not correct.
When we look at a step response with approximately correct fundamental characteristics, it looks "right" at first.
However, there are deviations which are not hidden in the up and down of the graph but are visible in the form of non-linearities in the course of the graph.
Almost like we know it from reading frequency response curves and phase diagrams. We should not be deceived by the visual impression of the measurement curves.
Similar looking step responses, for example, may therefore belong to very different sounding loudspeakers, because the seemingly small differences in the course of the graph may well indicate significant non-linearities. These non-linearities are of course also signal deformations, albeit of the lighter kind. Synchronizing the starting edges of different drivers in time is only the first elementary step towards proper conversion. But this does not mean that the frequency response linearity is good and the resonances are under control etc..
The ripples and deformations of step responses indicate lots of errors. They are deviations from the original and they are also audible and accordingly lead to justified criticism.
In the frequency response small resonance points are often hardly visible or at least not assessable. Often they are below - 20 dB. In the step response they show themselves by a more or less strong deformation of the graph; sometimes it is only a small hump that appears on the otherwise quite ideal course of the graph. This tiny hump or spike can significantly distort the sound image and spatial imaging and interfere with the natural perception of sound.
In noise you can hear phenomena < -30 dB with enough concentration. A phase shift or even inversion is always audible.
Frequency response non-linearities off-axis are of course always reflected in the graph of the step response, just as, for example, in the reproduction of a sine burst or in the reproduction of music.
This is the case with every loudspeaker, but it is not so easy to read with highly distorted step responses. Only if you measure the transient response over the entire frequency range in detail, you can see how many octaves are affected by a seemingly "small" fidget at the beginning of the step response.
The distortions already start in the midrange and affect the entire high frequency range.
The first example
We start with loudspeakers that have an easily interpretable step response. This serves as an introduction to the topic and makes it easier to understand. The choice of examples is for explanatory purposes and is otherwise arbitrary. (Source: www.stereophile.com)
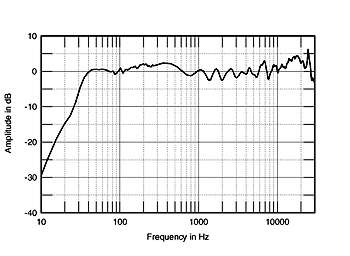
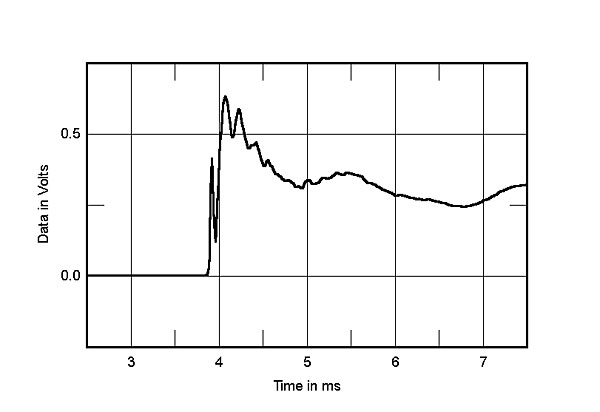
The following four diagrams are from the same speaker: Vandersteen 2Ce Signature II. The first one shows the step response.
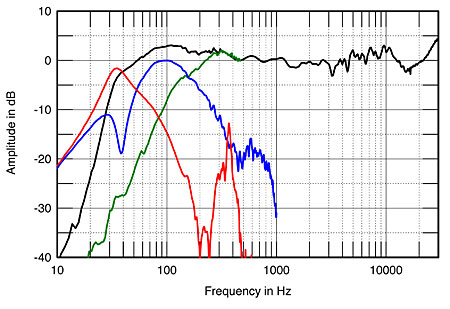
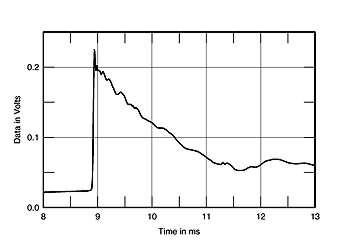
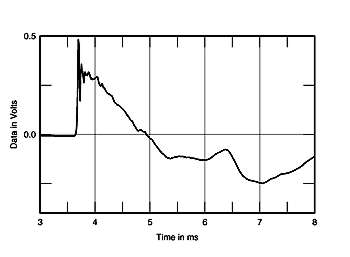 Diagram 2: The proportions of the step response - mid-high section (red), woofer (blue) |
The superposition, the interaction of red and blue, results in the sum of the step response of the whole system (Diagram 1). The measurement diagrams are to be evaluated under consideration of the small microphone distance. The summation at normal listening distances certainly looks better.
The step response starts with the rise time of the tweeter.
The energy introduced into the diaphragm movement is converted into sound with a slight time delay, resulting in an exaggerated peak at 3.8 ms. This is typical and quite normal given the naturally limited bandwidth of the transducer. The up and down in the area of the peak corresponds to the frequency response of the tweeter from 8 kHz upwards.
(see diagram 3: frequency response)
In the range of 4 - 5 ms there is a too strong sag, which we also see in the frequency response diagram as a slope from the highs to the mids.
The hump at 5 ms points to a slight problem in the transition from mid to bass driver, a slight phase shift.
 Diagram 3: Frequency Response |
 Diagram 4: Frequency response in space |
|
With this type of construction (3-way LS with tweeter on top, midrange driver and woofer in this order below) the following characteristic results in combination with the phase linear transitions of the drivers:
The vertical radiation pattern in the transition area between two drivers, e.g. midrange and bass, shows a dip in the frequency response when directed upwards, on the listening axis the frequency response is linear and directed downwards there is an exaggeration. The same happens between tweeter and midrange driver. The loudspeaker radiates louder downwards towards the floor than upwards towards the ceiling. The floor is usually the closest reflection surface. Therefore the frequency response increases as shown in Diagram 4.
The only remedy is to use strongly sound-absorbing material, preferably exactly halfway from the loudspeaker to the listener. Basically:
Any step response that shows multiple oscillations is fundamentally wrong! This is a clear distinctive feature. It is more difficult to establish a quality standard within the group of loudspeakers that behave "ideally" in the above sense. Here, criteria such as
the dynamic range the "linearity" of the graph the radiation behaviour can be used. That is, the step response is examined for its bandwidth, measured at different levels, at different angles, and examined for its "linearity". By "linearity" is meant the uniformity of the graph with the ideal shape and the ripple apparent on it. So you can see under which conditions the "correct" step response is generated by the loudspeaker and under which conditions it is not. Thereupon the application area of the loudspeaker could be determined. Loudspeakers / transducers that are able to reproduce rectangles within a certain bandwidth have a slightly different characteristic of the step response, they form a plateau for a short time. Due to the differences between the first and subsequent half-waves, this is only possible in conjunction with a frequency response that rises towards low tones in the steady state. |
The second example

|
|
|
The graphs above show the step responses of a three-way semi-active loudspeaker: This step response is typical of many three-way speakers with steep-edged filters. Sometimes the mid/high range is in phase, sometimes, as in this case, in phase opposition to the bass driver. Quite clearly visible is the highly distorted transient and the time sequence of the sound components of the tweeter, midrange and bass drivers. The midrange-woofer transient, which is completely separated from the tweeter, and the bass transient, which is completely separated from the midrange-treble (red graph), show the missing reference, the tearing apart of the sound components. It is irrelevant how many milliseconds lie in between. What is decisive is the sound waveform of the superposition, the sound that characterizes the percussion. |
|
Frequency response of the loudspeaker |
Further examples
|
There are non-linearities in the transmission response of loudspeakers, which basically result from the limited transmission bandwidth.
These limitations are also clearly seen in loudspeakers with largely correct step response. At the very beginning, where the signal starts, at about 3.7 ms the graph should go vertically upwards. But the tweeter has its limit in the rise time and the energy that should actually be generated at the beginning is slightly delayed.
This leads to the first somewhat exaggerated peak at about 3.8 ms.
So energy is radiated with a time delay and superimposed on the further course. | |
|
This step response shows the limits of the transmission range as well, just a little harder to see, as with all false step responses. The midrange driver here is polarized and the tweeter has a very poorly damped diaphragm resonance, which is visible in the negative pressure region in the form of the ringing on the curve. The non-linearity at 4.7 ms is either an error in the fundamental range or at a greater measuring distance already the first room reflection. One thing is also clear: no matter what signal is used to excite this loudspeaker, it will vibrate incorrectly, distorting the transient response. | |
|
Focal Electra 1037 Be' The following step response is exemplary of the state of loudspeaker technology. It is the step response of a 3-way loudspeaker. At about 3.75 ms the transient response of the tweeter starts. This is the first peak pointing downwards. The tweeter's polarity is reversed! The second peak pointing upwards produces the completely uncompensated and also very poorly damped post oscillation of the tweeter. The following downward oscillation between 3.9 and 4.1 ms is the result of the total antiphase of tweeter and midrange driver. The midrange driver is the only non-polarized driver of this loudspeaker, whose transient shows its peak at about 4.3 ms. The strong dip from about 4.6 ms below the zero line, into the negative pressure region, is produced by the bass system. Here we also see an extreme phase jump. Conclusion: The following graph is taken from the same loudspeaker and shows its frequency response that is actually quite balanced except for irregularities in the high frequency range with an extremely strong diaphragm resonance above 15 kHz. In the frequency response, which is measured from a quasi steady state during the measurement process, the problems with the impulse dynamics and the phase are not noticeable at all. | |
|
Marten Coltrane 3' | |
|
Vandersteen In the high frequency range it looks unsteady and the small hangover in the step response is due to the frequency response exaggeration in the fundamental range. | |
|
Dunlavy Signature SC-VI' This step response is very close to the ideal. |
The company Manger shows the measurement of other loudspeakers of different manufacturers.
More examples are described at the magazine Fairaudio.
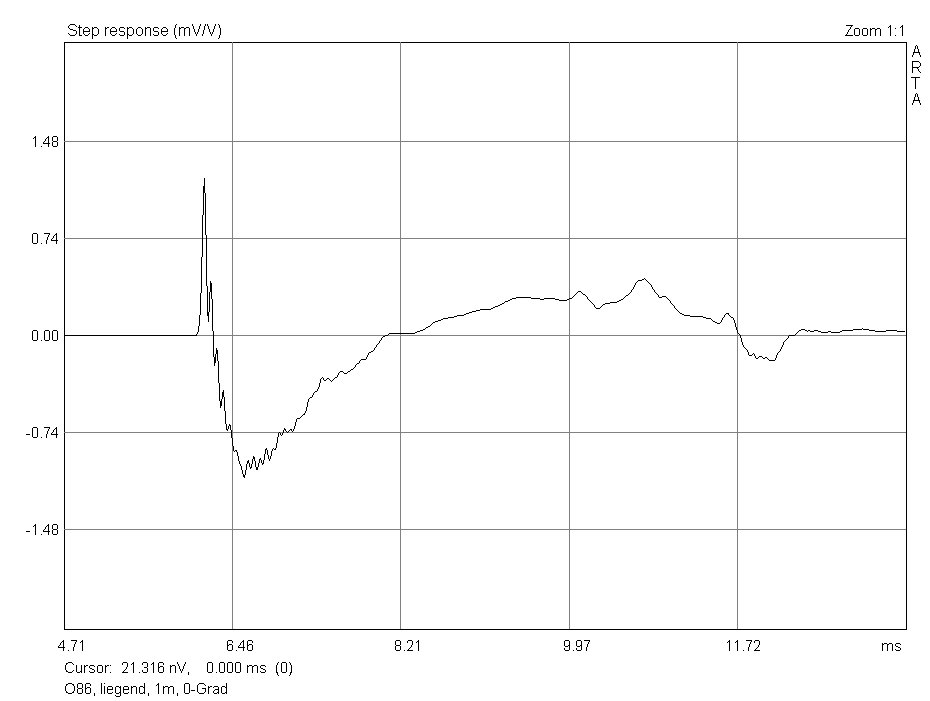
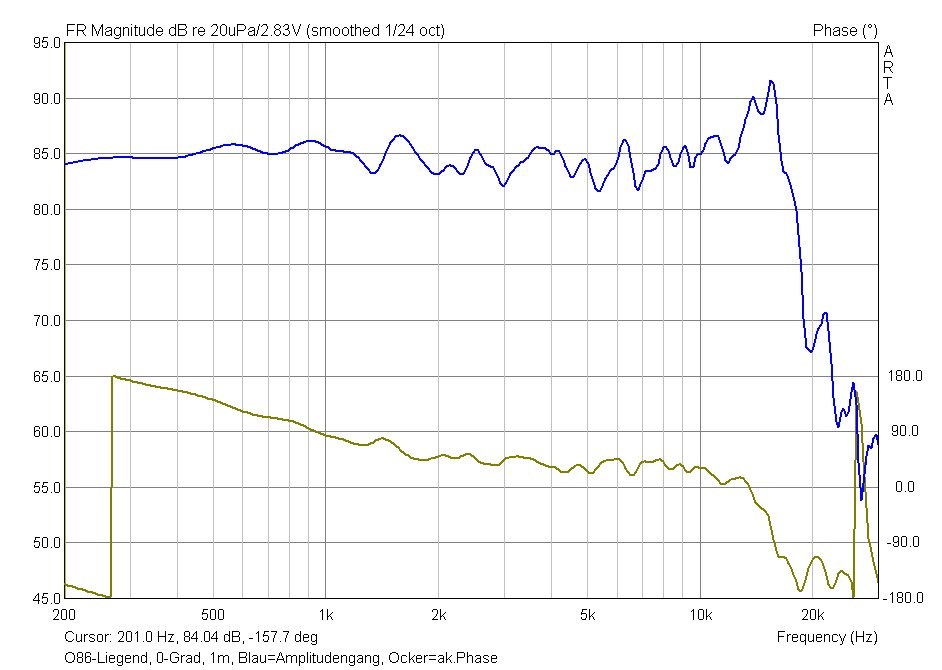
Also in the following example the same effects can be found vividly in the time domain (the step response) as well as in the frequency domain (the frequency response): The tweeter oscillates positively and produces the first peak upwards. The bass driver is connected in reverse polarity and produces the following downward oscillation. On this downward oscillation you can see a tremor. These are the undamped resonances of the tweeter, which overlap with the low frequency. In the frequency response these resonances can be seen as a rise starting at about 15 kHz. Also, the rapid drop of the tweeter towards 20 kHz indicates that these are resonances, since a controlled oscillating tweeter would not have such a strong drop. In settling this tweeter component is thus not available.
<zurück: Myroklopädie>
<zurück: Myro>


