Can You Measure Sound?
ContentsListening and measuringThe electroacoustic measuring technique serves primarily the visualization of acoustic and electrical events and in the broader sense of the structure-borne sound. That means, we transfer events, which take place on the perception levels hearing (acoustic events) and feeling (structure-borne sound and possibly electrical events), to the perception level seeing. This change of the mode of perception (in our case) from hearing to seeing leads, strictly speaking, in its logic to the statement that sound cannot be measured in principle. Sound is not a visible event. Accordingly, logically, blood pressure, for example, would not be measurable either, because we have a visualization in the form of numbers at the end of the measurement path. The measurement of the hearing ability at the hearing care professional consists of the measuring section signal generator and sensor system / evaluation by hearing and the evaluation in the brain (together => perception) by the test person and the data acquisition (e.g. the reaction time). At the end there is a visualization in the form of data tables and graphs. (Of course, the examiner could also be told the reaction times acoustically). However, if one defines the hearing of the measurement signals as an extension of the sensory system and evaluation, then one can certainly come to the conclusion that sound is measurable. Does the measurability of something presuppose the perception of the tester in the same perceptual mode? If so, then sound could only be measured by hearing. In practice, however, there is a consensus that changing the mode of perception does not call measurability into question; in fact, it is usually the goal of measurement procedures. Without this, we would not be able to measure e.g. wavelengths / radiation that are not perceptible to our brain at all. In view of these considerations, one can certainly speak of sound being measurable. One can also use a signal structure "defined as sound" as a measuring signal. This would also correspond to the term sound. When does what is heard differ from what is measured? "The incorrectness in testing conventional loudspeakers lies not in what is measured, but in what is not measured." As long as measurement results are unambiguously perceptible and interpretable and one does not change the experimental setup, what is heard (the measurement signal of the experimental setup) does not differ in relevant magnitude from what is measured, i.e. the correlation is reproducible and plausible. If what is measured is not clearly perceptible (e.g. visible or visually distinguishable) and / or interpretable, then a comparison of what is heard and what is measured is no longer possible, because one part of what is being compared is practically omitted. Differences between what is measured and what is heard can occur if what is measured does not reflect the characteristics of the sound event. Furthermore, differences occur if the test setup is changed when comparing the heard and the measured, if the measurement signal is not equal to the heard sound event and / or if the measurement distance is not equal to the transmission distance when listening. Another reason for a difference between what is heard and what is measured is due to the perceiving human being, since he has a more or less pronounced "hearing ability" and also allows experiences, memories, moods, prejudices, etc. to flow into the perception and thus perceives fundamentally subjective. This problem is possibly much greater when listening to music than when listening to the simpler, shorter measured signals. To music, we all have an idea of how it should sound. We think we know what the recorded piano should sound like, for example. While the sound engineer still has the comparison to the original sound of the instrument, this is completely missing when just listening to recordings! The listener does not know how a recording must sound if he was not present at the recording and did not hear the musicians in the original. |
There are limits to evaluating measurement results, to the images our eyes see. No speaker is linear to a tenth of a decibel, and thus beyond a certain level of interpretive ability, subjective conjecture or assessment takes the place of objectivity. Fortunately, our hearing is far more capable of interpretation than the brain based on metrological images. For example, there are play-in phenomena that are not measurably detectable with the usual methods, but nevertheless have a noticeable influence on the hearing sensation. This is proof that our hearing is far more sensitive and resolving than we generally assume. This is where hearing begins in development. The easiest and most reliable method, especially when fine-tuning filters, is to listen with pink noise. This listening has to be learned. Otherwise, one is not evaluating the filter applied for tuning, but other sensations when listening to noise. Noise is a complex dynamic noise that is largely constant when averaged, making it easier to work with, but it also closely resembles the transients within music, making it a very good way to evaluate the dynamic, temporal behavior of filters.
Where the measurement technique ends, the noise begins!
'How does Myro deal with conflict situations where what is heard is different from what is seen?"
By being aware of what has been presented before, and by working on the many shortcomings without blinkers, on perception and on the meticulous search for the most useful measurement procedure and the most meaningful method, visualization and listening experience.
In electroacoustics, however, we are primarily dealing with errors of a magnitude that can be clearly shown by measurement. Here we are mainly dealing with boulders, not fine dust! This will be dealt with if the boulders could be moved out of the way. And if this should not be possible, then one should rather pursue a new concept.
Basics for measurementsThe term "electroacoustic transducer" is actually shortened. More accurate would be "electro-mechanical-thermal-acoustic transducer". This reflects the complexity we are dealing with. And this is also the reason why the models used in simulations do not really work: too many assumptions and exclusions have to be made. Theories and measurement techniques are too complex for simple model building. In practice we have to deal with some non-linearities and disturbances (like rumble, noise etc.). Chassis in themselves are complex in their behavior and nonlinear in most properties. The interaction of the drivers with each other, the cabinet and the spatial environment is equally complex and nonlinear. Resonance points build up, collapse and then reappear, etc. Chassis behave in a time variant manner! Or the suspensions: They have compliance that corresponds to some function, at least in theory. But they also have resonant behavior. They generate natural vibrations that propagate as structure-borne sound in the material, in materials connected to it, and in the environment in the form of sound waves that are reflected, and so on. The interaction with the other components of the chassis are manifold, complex and chaotic, e.g. the diaphragm or the cabinet; also the chaotic behaviour of the excited materials (diaphragm, suspensions etc.) with the many different time constants with their time-delayed feedback effects in the form of radiated sound and in mechanical form, e.g. on the drive and the non-linearities of the drive itself etc.. This is why simulations and measurements in steady state (e.g. FFT) are far from reality! This is why Myro does not go into the depths of individual measurement models and equivalent circuits. Instead, one looks directly at the signal / sound structure before it goes into the confines of a model under assumptions and exclusions. The Dynamic Measurement method was also devised for this purpose. |
The Measurement System
Unbiased measurement results require a precise measurement system. The measurement equipment should be several octaves wider in bandwidth than the DUT. Myro uses the ATB Precision, a computer-aided measuring device from Kirchner-Elektronik with additional Dynamic Measurement Software. An amplifier power amplifier Audionet AMP I is used for perfect amplification of the measurement signals. A very large number of amplifiers is not capable of delivering low frequency square wave signals or even a pure DC jump. Even a pure DC-surge has to be switched off at some point, so it is a square wave signal in the end. Even a clean rising edge is usually a problem for amplifiers.
The choice of the measurement microphone is also of great importance (along with the mounting). It has to be linear and extremely broadband. Very many measurement microphones rise in frequency response from 10 kHz and fall off from 15 - 20 kHz. The diaphragm resonance should be at least one octave, for impulse measurements at least two octaves above the range to be measured. Even for a serious 20 kHz measurement, a microphone with a diaphragm resonance of at least 40 kHz, or even better 80 kHz, is required! This assumes a corresponding linearity of the frequency response. To be able to measure e.g. 25 kHz halfway cleanly, the microphone should be linear up to at least 100 kHz. Otherwise, the beginning of the square wave signal / step response will also look bent. The majority of microphones already show significant deviations starting at 15 kHz. For the measurements up to 50 kHz, which are intended in the case of the diamond tweeter, only a few measuring capsules come into question, because measurements in the ultrasonic range are necessary to detect possible diaphragm resonances.
Therefore, a high-precision microphone from Microtech Gefell, the MK 301 condenser microphone with corresponding microphone preamplifier and power supply, is used to record the sound. This microphone has an excellent linearity and a transmission range up to 100 kHz. The measurements take place mainly in the company's own anechoic room.
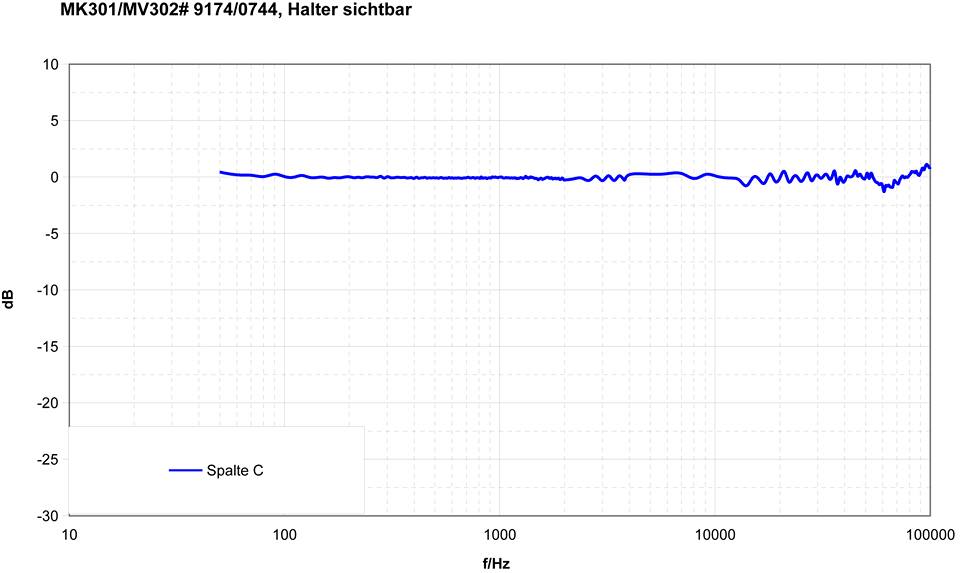
Frequency response of the Myro measurement microphone (frequency response up to 100 kHz, deviation max. +/- 1 dB)
Real operating conditions include a listening / measuring distance of usually more than 2 m for loudspeakers. It is important that the rising edges of the drivers are in correct relation to each other at a practical distance of the microphone: Depending on the loudspeaker model, practical for Myro is 1.5 - 5 m (from 3 m free field). Measurements at close range naturally lead to different results than at greater distances. At close range, the radiation angles and the distances of the individual systems to the recording position change. This results in errors in the summation under the time and pressure aspects. With increasing distance the systems behave synchronously and the summation is correct again. Only at long distances the higher damping of the air at high frequencies becomes noticeable and leads to a noticeable drop in the high frequencies. Listening to the tweeter at an angle of a few degrees has much more dramatic effects.
If you design your loudspeakers for a distance of 1 m, you will find out that it is not true for practical listening distances. Loudspeakers are always designed for different applications. The minimum listening distance depends on the loudspeaker design. The size of the drivers, the number of ways and the distance between the systems define the minimum distance. However, in view of the need to obtain the smoothest possible measurement curves for publication purposes due to the lack of sufficiently large, anechoic chambers, measurement within short distances has become established. In times when the power of test magazines was unbroken, some manufacturers copied the measurement conditions used there by necessity in order to get the good ratings in the test. Thus, all those who measure under these conditions adapt their measuring conditions to an emergency situation, but not to the practical and natural conditions.
Example: Thiel CS 3.7
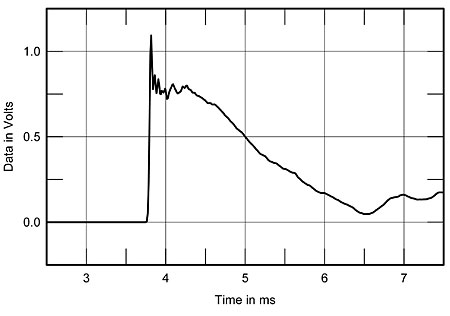
The Thiel CS 3.7 is a properly walking loudspeaker and, as it should be for private use, has been tuned to a listening distance typical for it. At this distance the step response is correct. The model looks like this:
Source: www.stereophile.com
At the top is the mid-high coaxial chassis, below that the woofer, at the bottom the passive diaphragm. The step response is measured at the height of the coaxial chassis, microphone distance 1.27 m.
Dynamic Measurement... a sound analysis method for loudspeakers and electronics.
1 sine period
0.5 square wave period In music reproduction, an electroacoustic transducer is excited with a complex signal structure. The use of a half-wave or a sine period as the measurement signal serves to simplify the detection of the transducer characteristics of loudspeakers compared to measurements using more complex waveforms. The Dynamic Measurement method is thus an even better basis for the interpretation of dynamic behavior. It practically splits the step measurement into half waves and displays them individually in 3D. Hereby the reference to the respective frequency is established and the effects can be better assigned. Up to 300 individual measurements in a freely selectable frequency range are possible. The frequency ranges can be defined in the following steps:
up to 1,000 Hz in 100 Hz steps up to 10,000 Hz in 1,000 Hz steps up to 30,000 Hz in 10,000 Hz steps So you can make 300 single measurements within a bandwidth of 10 Hz and so on. The Z-axis is scaled from 1 to 16 periods. There is a front and a rear view. In addition, a side view and a top view are made possible by continuously compressing the X and Y axes.
Furthermore, there is an upsidedown function; i.e. you can view the whole thing from the bottom. A 2-D representation of each individual measuring step is possible, with additional tools. |
<zurück: Myroklopädie>
<zurück: Myro>
